PU Prime App
Exclusive deals on mobile


PU Prime App
Exclusive deals on mobile


Hold The Global Markets In Your Hands
Our trading mobile app is compatible with most smart devices. Download the App now and start trading with PU Prime on any device, anytime and anywhere.


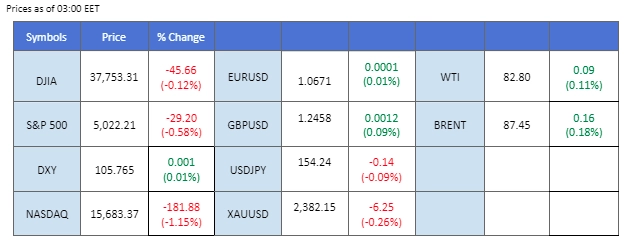
The U.S. dollar experienced a technical retracement, easing from its 2024 peak and breaking below the $106 mark. Despite this, robust U.S. economic performance and the Federal Reserve’s hawkish stance are expected to provide underlying support to the dollar. Concurrently, the easing dollar has allowed its peers to make gains, notably the Japanese Yen, which recovered from its weakest level in 34 years. In recent developments, the U.S. Treasury Secretary met with the Japanese Finance Minister, where it was stated that the U.S. would tolerate intervention in the foreign exchange market due to concerns over the recent sharp depreciation of the Japanese Yen.
In the commodities market, while gold prices have seen a slight decrease, oil prices experienced a significant drop in the last session. This was influenced by an accelerating build-up in U.S. crude inventories and concerns about oil demand, which overshadowed the ongoing tensions in the Middle East. However, amid the geopolitical uncertainty in the region, the U.S. is considering reimposing oil sanctions on Venezuela, which could potentially reduce oil supply in the market and stimulate a surge in oil prices.
Current rate hike bets on 1st May Fed interest rate decision:
Source: CME Fedwatch Tool
0 bps (97%) VS -25 bps (3%)


(MT4 System Time)


Source: MQL5


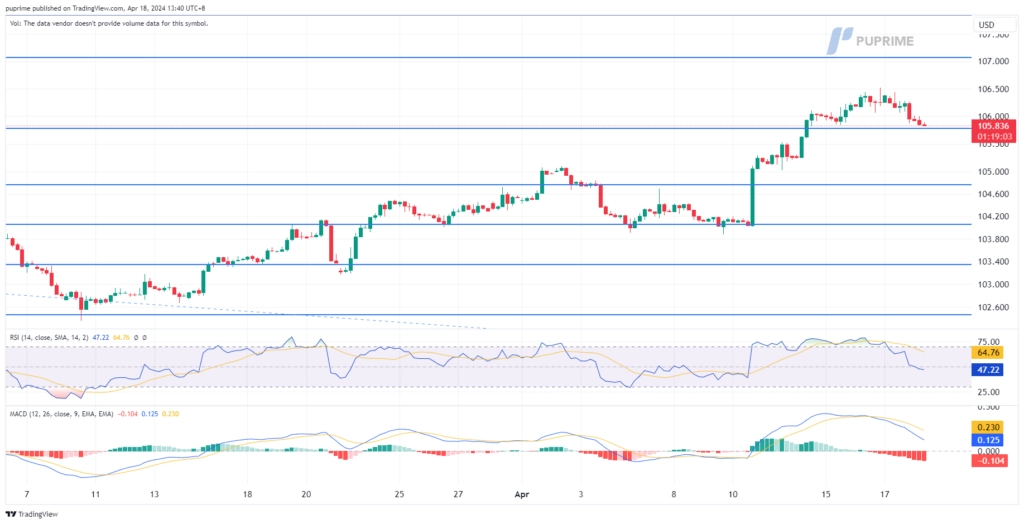
The Dollar Index, tracking the greenback against major currencies, saw its first decline in six days as investors engaged in profit-taking amid a shift back to a cautious “wait-and-see” stance. With Federal Reserve officials emphasising the importance of incoming economic data in shaping interest rate decisions, market focus has pivoted towards data performance for further trading cues. The Fed’s Beige Book report indicating modest economic growth without significant inflationary pressures has added complexity to the monetary outlook, prompting investors to closely monitor upcoming economic releases for clarity.
The Dollar Index is trading lower while currently testing the support level. MACD has illustrated diminishing bullish momentum, while RSI is at 67, suggesting the index might enter overbought territory.
Resistance level: 107.05, 107.85
Support level: 105.80, 104.75
Gold prices remained range bound as investors grappled with mixed fundamentals and geopolitical tensions. The yellow metal struggled to find clear direction amidst conflicting factors, including the Federal Reserve’s hawkish stance and better-than-expected US economic data weighing on demand, countered by rising tensions in the Middle East bolstering safe-haven appeal. As uncertainties persist, investors are closely monitoring geopolitical developments and sanctions implementations for trading signals.
Gold prices are trading flat while currently near the support level. However, MACD has illustrated diminishing bearish momentum, while RSI is at 40, suggesting the commodity might trade higher since the RSI rebounded sharply from oversold territory.
Resistance level: 2375.00, 2400.00
Support level: 2360.00, 2340.00
The GBP/USD pair has managed to find support from its recent downtrend, currently hovering near the 1.2440 level. The latest UK CPI data, released yesterday, indicates that inflation remains persistently high, hovering above 3%. This persistent inflation suggests that the Bank of England may maintain its monetary tightening policy for an extended period, thereby bolstering the strength of the Sterling.
The GBP/USD pair is consolidating after a bearish trend that suggests a potential trend reversal. The RSI has rebounded from near the oversold zone, while the MACD has crossed below and is heading to the zero line, suggesting the bearish momentum is vanishing.
Resistance level: 1.2540, 1.2660
Support level: 1.2370, 1.226
The EUR/USD pair experienced a technical rebound from its recent lows, supported by a softening U.S. dollar. Yesterday’s Eurozone CPI data came in at 2.4%, closely aligned with the European Central Bank’s (ECB) target rate of 2%. Contrasting with the recent hawkish remarks from the Fed Chair, the softer Eurozone CPI has led market participants to speculate that the ECB might consider its first rate cut as early as June. This anticipation could potentially apply long-term downward pressure on the Euro.
EUR/USD has broken above its consolidation range and formed a higher high price pattern, suggesting a trend reversal signal. The MACD is approaching the zero line from the bottom, while the RSI has rose sharply from the oversold zone, suggesting bullish momentum is forming.
Resistance level: 1.0700, 1.0775
Support level: 1.0560, 1.0500
The Japanese yen strengthened against the U.S. dollar in the last session as the dollar underwent a technical retracement. Concurrently, U.S. authorities expressed concern over the sharp depreciation of the Japanese yen and acknowledged the rationale behind potential interventions by Japanese authorities in the foreign exchange market to stabilise their currency.
USD/JPY retraced from its recent high level but has yet to hit its previous low, suggesting that the bullish momentum remains strong. The RSI has dropped out of the overbought zone, while the MACD has crossed on the above, suggesting that the bullish momentum has eased slightly.
Resistance level: 154.90, 156.50
Support level: 153.30, 151.85
The US equity market experienced downward pressure, led by a slide in the tech sector driven by profit-taking and disappointing earnings reports. NVIDIA’s significant decline, coupled with weakness in other tech giants such as Netflix, Apple, Meta, and Microsoft, weighed on market sentiment. Additionally, chip stocks, including ASML, faced headwinds following lacklustre first-quarter new bookings. Rising Treasury yields further dampened sentiment in the growth sector, exacerbating concerns over persistently higher interest rates amid geopolitical tensions in the Middle East.
Dow Jones is trading lower while currently testing the support level. However, MACD has illustrated diminishing bearish momentum, while RSI is at 30, suggesting the index might enter oversold territory.
Resistance level: 39150.00, 39855.00
Support level: 37700.00, 36560.00
Crude oil prices continued their downward trajectory following a bearish inventory report, with US Crude oil inventories surpassing market expectations. The higher-than-anticipated inventory build suggests ongoing weakness in oil demand, exerting downward pressure on prices. However, the market’s losses were tempered by the possibility of renewed oil sanctions on Venezuela and Iran, with investors closely monitoring developments for insights into potential supply disruptions.
Oil prices are trading lower while currently testing the support level. MACD has illustrated increasing bearish momentum. However, RSI is at 26, suggesting the commodity might enter oversold territory.
Resistance level: 84.65, 87.50
Support level: 82.25, 80.45


Trade forex, indices, metal, and more at industry-low spreads and lightning-fast execution.
Sign up for a PU Prime Live Account with our hassle-free process.
Effortlessly fund your account with a wide range of channels and accepted currencies.
Access hundreds of instruments under market-leading trading conditions.